What is this page?
The Cohort Retention page helps you understand how well you retain customers over time. It groups customers into cohorts based on when they made their first purchase, then tracks what percentage of each cohort comes back to buy again in subsequent periods. A retention heatmap makes it easy to spot trends -- are newer customers more loyal than older ones? Is retention improving month over month?
Key Metrics on This Page
Retention Rate
- What it shows: The percentage of customers from a given cohort who made a purchase in a specific later period.
- Formula:
(Customers who purchased in period N / Total customers in cohort) x 100 - Important: Higher retention rates mean more customers are coming back. Even small improvements in retention can significantly increase total revenue over time.
Cohort Size
- What it shows: The number of new customers who made their first purchase during each cohort period.
- Important: Larger cohorts give more statistically meaningful retention rates. A very small cohort (e.g., 5 customers) can have volatile retention percentages.
Repeat Purchase Rate
- What it shows: What percentage of a cohort made at least one additional purchase after their first.
- Formula:
(Customers with 2+ orders / Total customers in cohort) x 100 - Important: This is your overall "stickiness" metric. The industry average for e-commerce is typically 20-30%.
Features
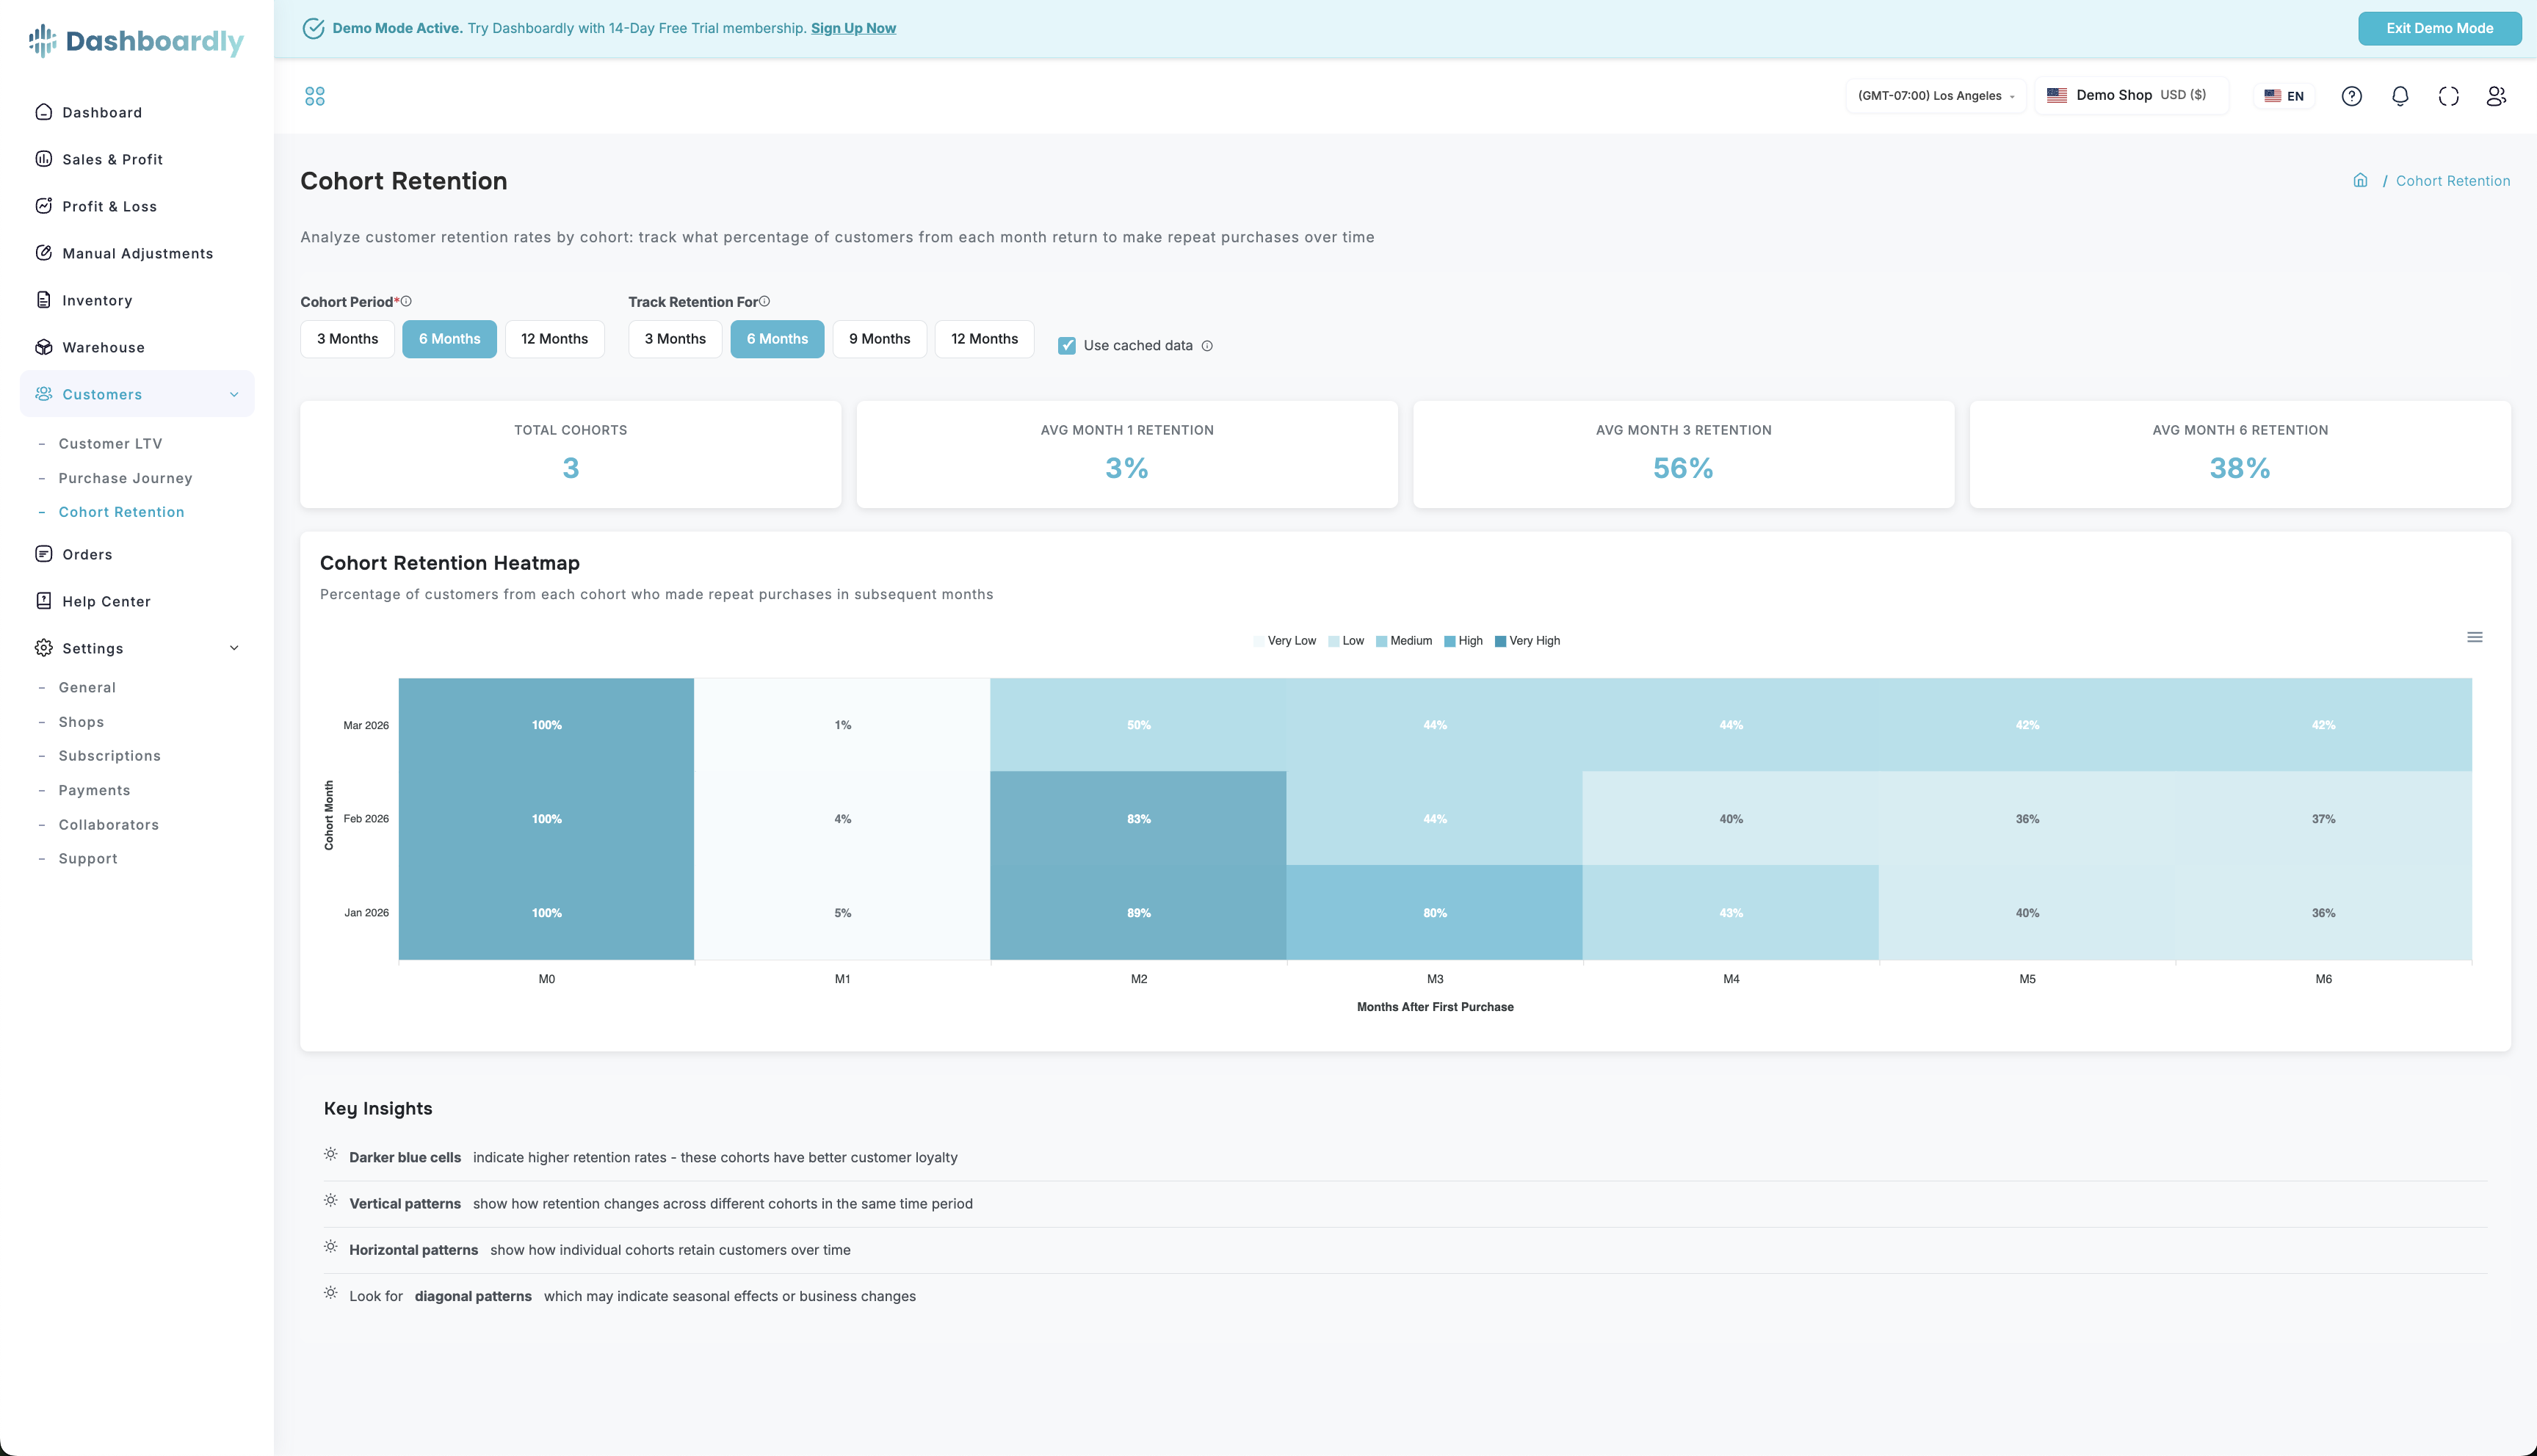
Retention Heatmap
The main visualization is a color-coded table (heatmap):
- Rows: Each row represents a cohort (group of customers who first purchased in the same period)
- Columns: Each column represents a subsequent time period (Month 1, Month 2, Month 3, etc.)
- Cell color: Darker green indicates higher retention; lighter shades indicate lower retention
- Cell value: The exact retention percentage
The heatmap reads left to right. The first column (Month 0) is always 100% because every customer in the cohort made at least one purchase. Subsequent columns show what percentage came back.
Period Selection
Choose how to group your cohorts:
- Weekly -- each cohort is one week of new customers
- Monthly -- each cohort is one month (most common)
- Quarterly -- each cohort is one quarter
Weekly cohorts are best for short-term analysis and fast-moving shops. Monthly is ideal for most sellers. Quarterly smooths out seasonal variations.
Retention Trends
A trend line chart that shows how retention rates have changed over time. This helps you answer questions like: "Is my Month-2 retention getting better or worse compared to earlier cohorts?"
Date Range
Select the date range for cohort analysis. Wider date ranges show more cohorts but require more data to be meaningful.
Common Questions
How do I read the retention heatmap?
Each row is a group of customers who first bought in the same period. Read across the row to see what percentage came back. For example, if the "January 2026" row shows 15% in the "Month 2" column, it means 15% of customers who first bought in January 2026 made another purchase two months later.
What is a good retention rate?
For TikTok Shop sellers, a Month-1 retention rate of 10-20% is typical. Top-performing shops may see 25-35%. Month-2 and beyond will naturally be lower. Any improvement over time is a positive signal.
Why is the first column always 100%?
The first column (Month 0 or Week 0) represents the cohort's initial purchase period. By definition, 100% of customers in that cohort made at least one purchase during that time -- that is how they entered the cohort.
Why do newer cohorts have fewer columns?
Newer cohorts have not had enough time to generate retention data for later periods. For example, a cohort from last month can only show Month-0 and Month-1 data because Month-2 has not happened yet.
How is this different from the Purchase Journey page?
Purchase Journey shows which products customers buy in sequence (the path). Cohort Retention shows whether customers come back at all, regardless of what they buy. Journey answers "what do they buy next?" while Retention answers "do they come back?"
How can I improve my retention rates?
Several strategies can help:
- Follow-up communication -- reach out to first-time buyers within a week of their purchase
- Product quality -- customers who receive quality products are more likely to return
- Loyalty incentives -- offer returning customers exclusive discounts or early access to new products
- Product variety -- shops with a wider catalog tend to have higher retention because customers find more reasons to come back
What does it mean if newer cohorts have better retention?
This is a positive signal. It usually means your recent improvements (better products, better customer experience, better marketing) are working. Compare recent cohorts to older ones at the same period to confirm the trend is real and not just a sample size effect.