What is this page?
The Purchase Journey page (also known as Customer Journey or Cohort Journey) visualizes how customers move between products across multiple purchases. Using a Sankey diagram, it shows the flow of customers from their first purchase to their second, third, and beyond -- revealing which products attract first-time buyers, which products drive repeat purchases, and where customers tend to drop off. This helps you understand product relationships and optimize your catalog strategy.
Key Metrics on This Page
The page surfaces metrics in two layers: summary cards at the top of the page, and a Key Insights panel below the Sankey diagram.
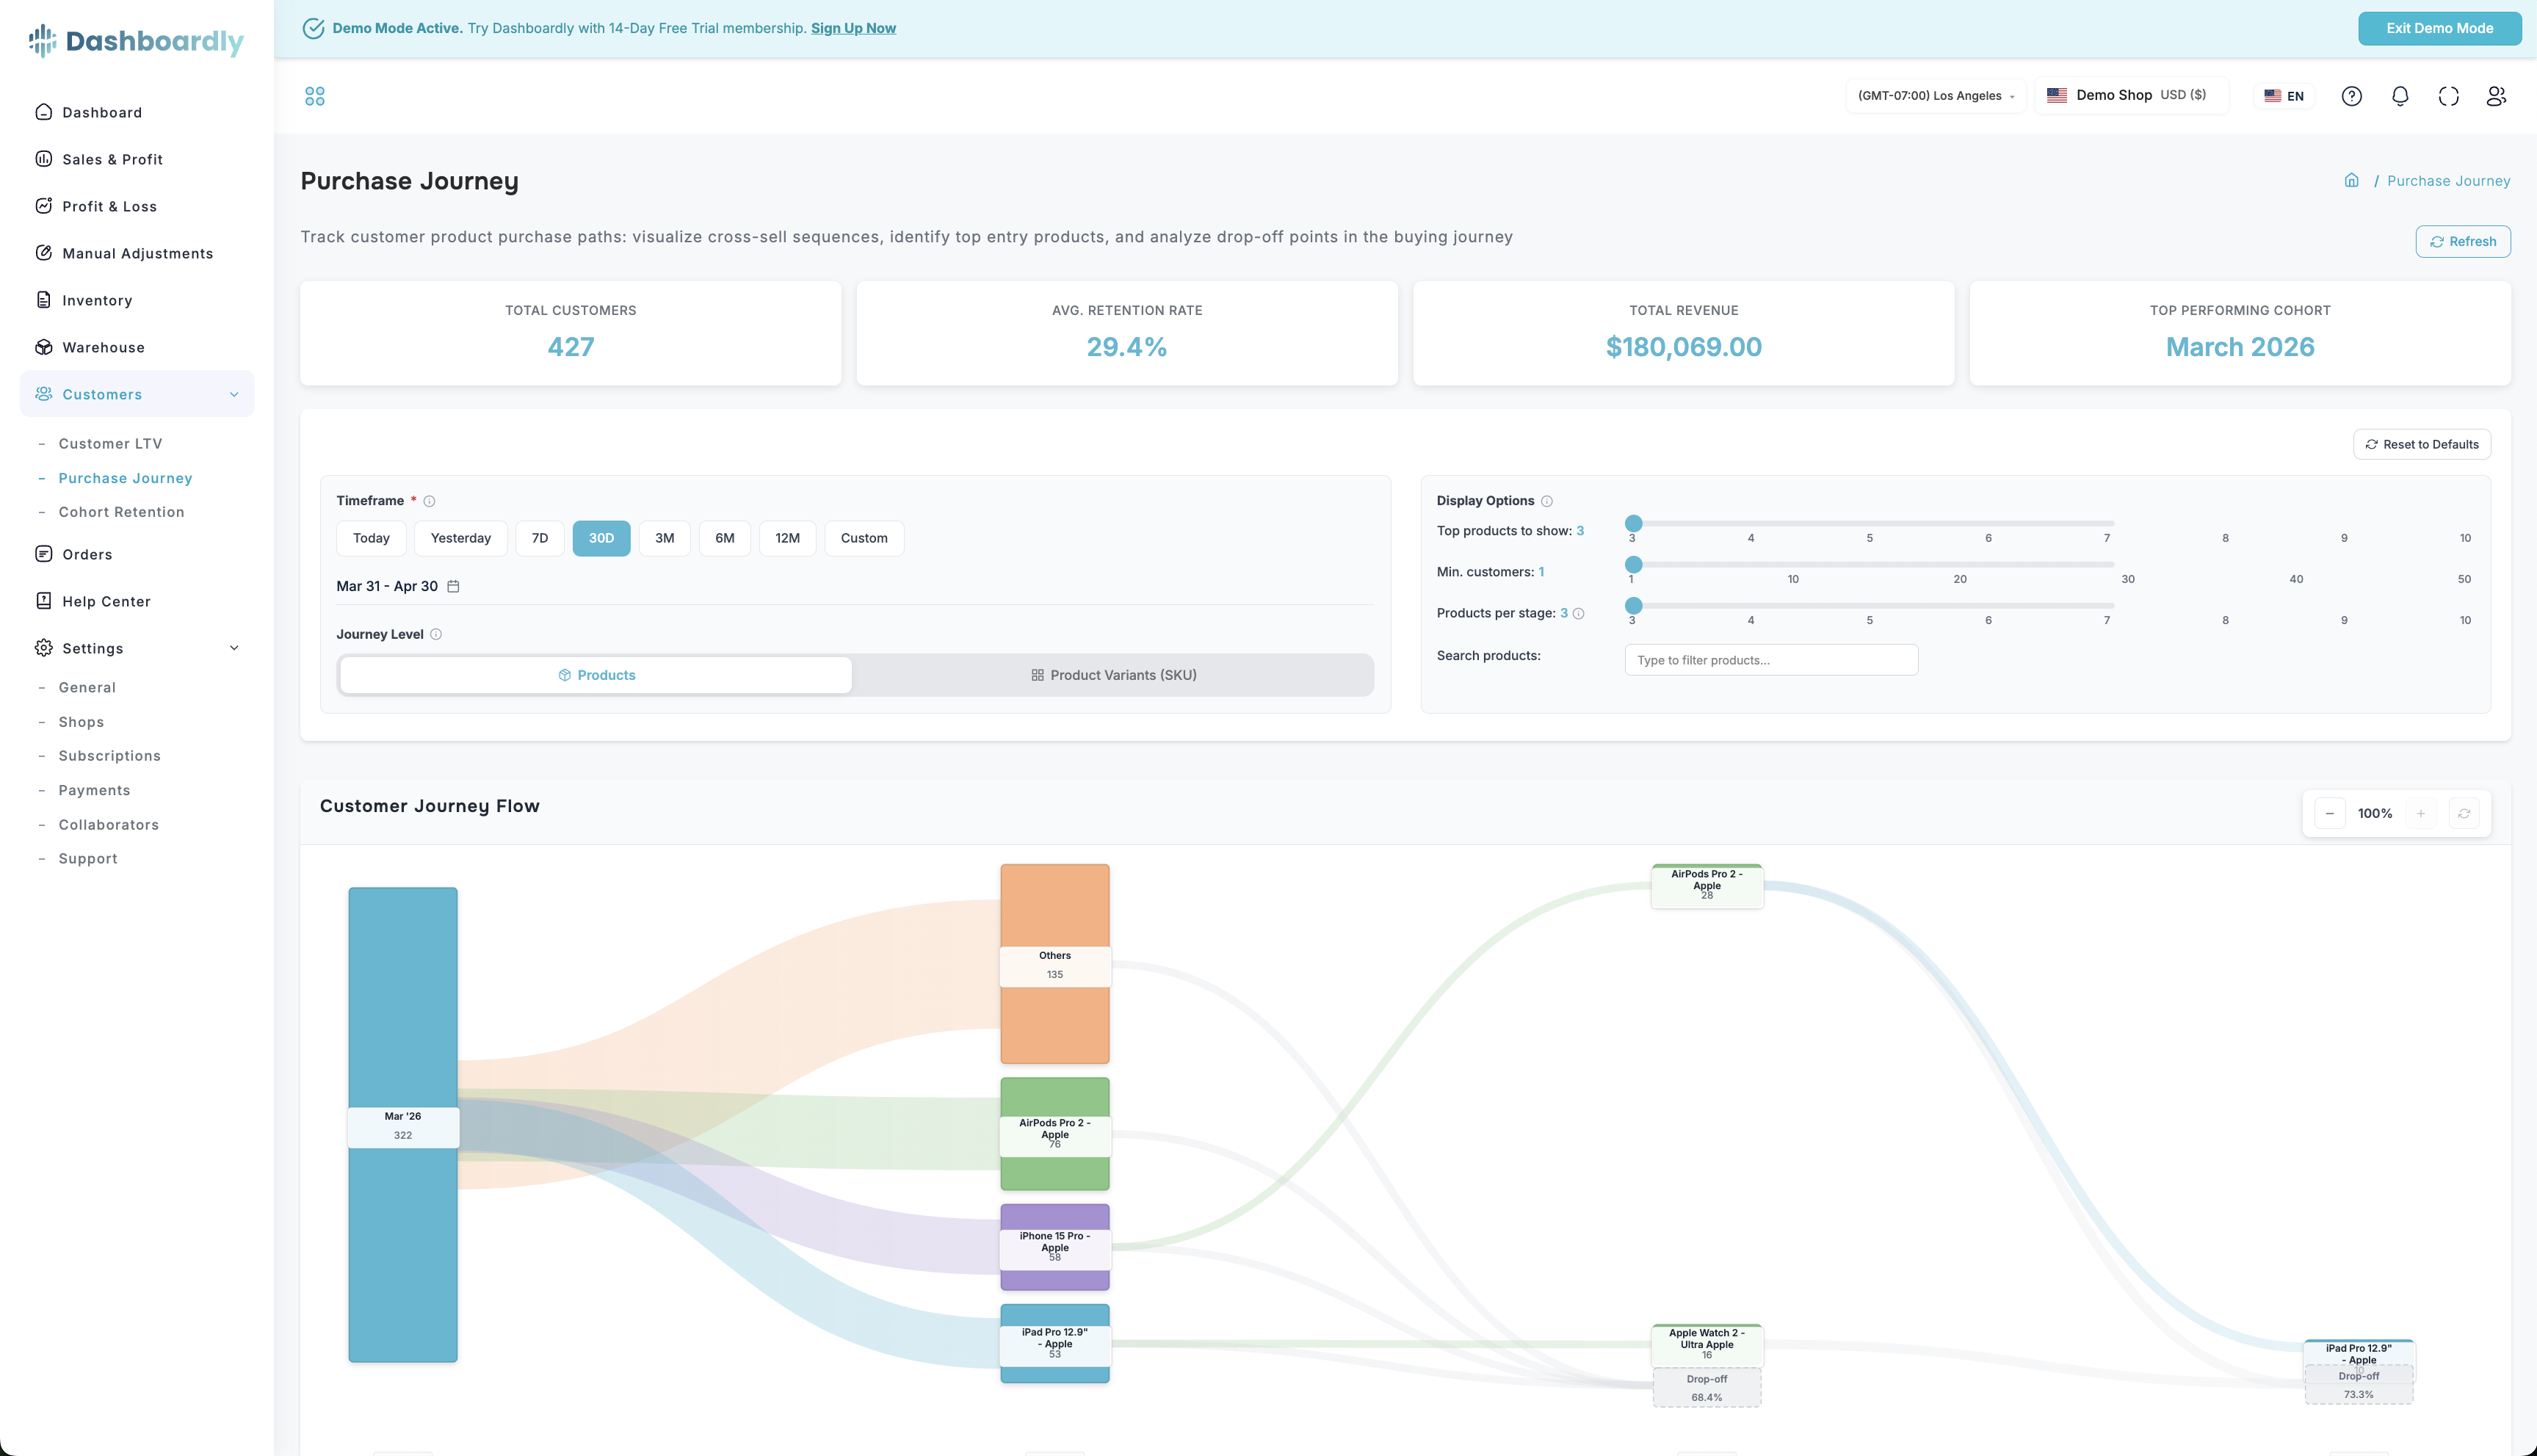
Summary Cards (top of page)
A row of four cards summarizes the selected date range:
-
What it shows: The number of unique customers included in the journey analysis for the selected date range.
-
What it shows: The percentage of customers who make a second purchase, averaged across the analyzed cohorts.
-
Important: A low retention rate means most customers only buy once -- use the Sankey to spot which products break this pattern.
-
What it shows: Total revenue generated by the customers included in the journey analysis.
-
What it shows: The cohort (entry product or first-purchase group) that generated the highest revenue or retention in the selected period.
Key Insights Panel (below the Sankey)
Four insight cards are generated automatically from your customer data:
-
What it shows: Retention rate, the purchase step at which most customers stop buying (drop-off stage), and the drop-off rate at that stage.
-
What it shows: Which products attract the most first-time buyers, with average price information -- your best "entry point" products for customer acquisition.
-
What it shows: Revenue distribution across purchase steps -- where the bulk of cohort revenue is earned.
-
What it shows: Narrative summary of the flow -- common paths, strongest repeat pairings, and stages where journeys branch or collapse.
Features
Sankey Diagram
The main visualization is a Sankey (flow) diagram showing:
- Left side: First purchases grouped by product
- Flowing right: Subsequent purchases for customers who bought again
- Line width: Proportional to the number of customers in that path
- Colors: Different colors for different products to make paths easy to follow
Hover over any flow line to see the exact number of customers and the products involved.
Filters
- Date range -- choose the period to analyze
- Number of steps -- control how many purchase steps to display (e.g., first 3 purchases, first 5 purchases)
- Minimum threshold -- hide paths with very few customers to focus on significant patterns
Product Focus
Click on a specific product to highlight all paths that include it, making it easy to trace how one product connects to others in the customer journey.
Actionable Takeaways
Use the journey data to inform your business strategy:
- Identify gateway products -- products that attract first-time buyers and lead to repeat purchases
- Create product bundles -- pair products that commonly appear together in the journey
- Target drop-off points -- use follow-up marketing at the stage where most customers stop buying
- Optimize catalog -- invest in products that drive the longest customer journeys
Common Questions
What does a wide flow line mean?
A wider line means more customers followed that path. For example, a wide line from Product A (first purchase) to Product B (second purchase) means many customers buy Product B after Product A.
Why do most customers drop off after the first purchase?
This is common in e-commerce. Many TikTok Shop buyers are impulse purchasers who may not return. You can use this data to identify which products have the best repeat rates and focus your marketing efforts accordingly.
How is this different from the Customers page?
The Customers page shows individual customer data (who they are, how much they spent). The Purchase Journey page shows aggregate patterns across all customers -- it is about the flow of behavior, not individual profiles. For cohort-level retention detail, see the Cohort Retention and Customer LTV sub-pages.
Can I see which products customers buy together in the same order?
The Customer Journey tracks purchases across separate orders over time. For products bought together in a single order, check the order details on the Orders page.
How far back does the journey data go?
The journey includes all orders in your selected date range. For the most meaningful patterns, select a longer time period (3-6 months or more) to capture repeat purchase behavior.