
What is this page?
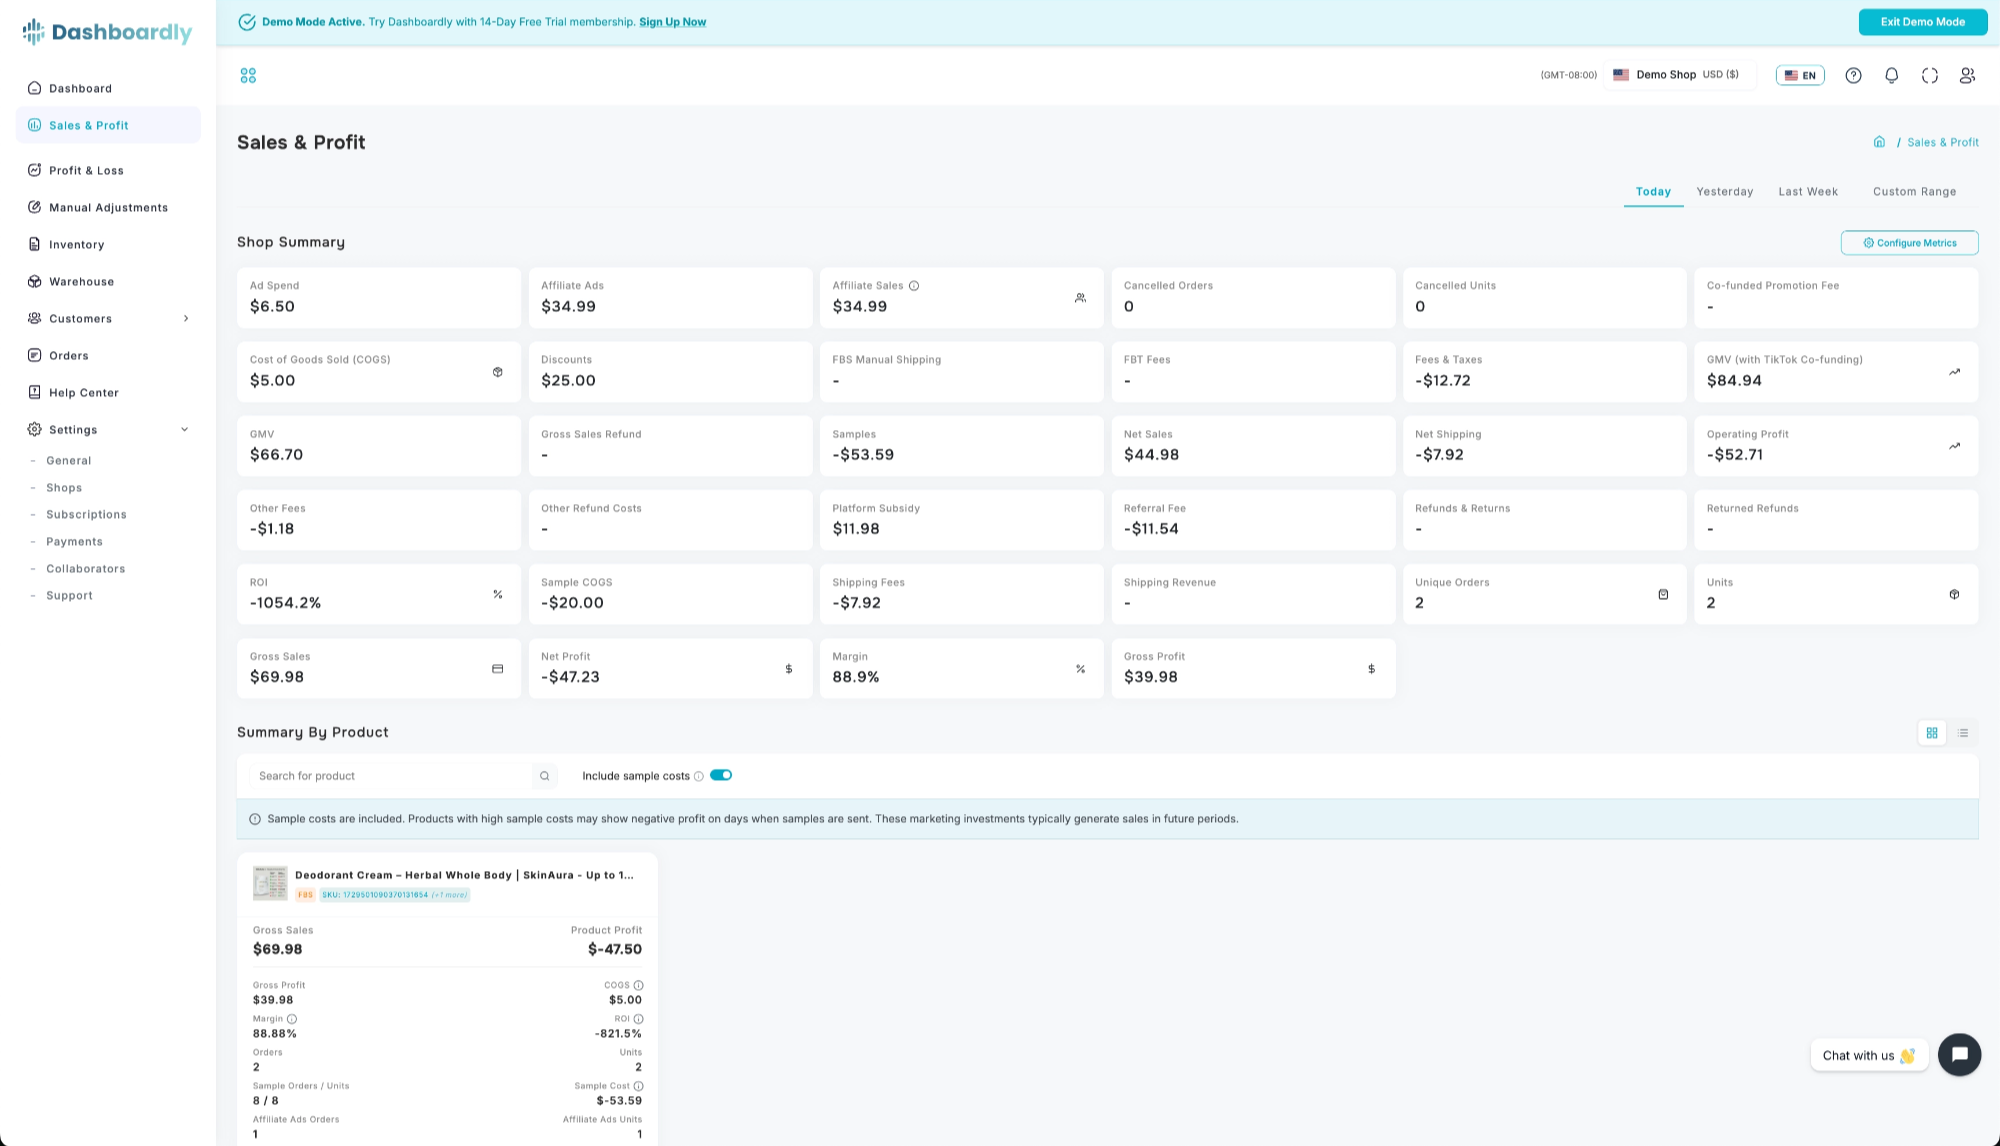
The Sales & Profit page breaks down your financial performance at the product level. While the Dashboard gives you a shop-wide overview and the Profit & Loss shows a full financial statement, this page lets you see exactly how much revenue, profit, and margin each individual product generates -- helping you identify your winners and underperformers.
After your overage cap is exhausted
Sales & Profit remains available with the same date range, search, product or SKU view, Sales Scope, accounting basis, and export controls. Order-derived totals, product rows, drill-downs, comparisons, and exports include only orders that were visible before the cap was exhausted. New post-cap orders continue syncing securely and stay out of customer-visible results. Billing-cycle renewals and overage-cap edits do not reveal held orders. They are released only after a plan upgrade, activation of an approved custom plan, or an approved support action. No additional overage charges accrue while the cap is exhausted. Costs that do not come from an order, such as Ad Spend or a Manual Adjustment, may continue to update.
Key Metrics on This Page
This page shows both a Shop Summary (aggregate metrics across all products) and a per-product table with the same metrics broken down by product.
Gross Sales
- What it shows: Total revenue from product sales before any discounts, for each product.
- Formula: Sum of (Original Price x Quantity) for each item sold
- Example: You sold 50 units of Product A at $30 each. Gross Sales for Product A is $1,500, regardless of any discounts you offered.
- Important: Uses the full original product price, not the discounted amount. Gross Sales is merchandise-only and does not include customer-paid shipping; shipping is tracked separately. See Revenue Metrics.
Net Sales
- What it shows: Revenue after subtracting seller discounts, per product.
- Formula: Product Sales - Discounts
- Example: Product A has $1,500 in Product Sales and $200 in Discounts. Net Sales = $1,300. Shipping revenue is tracked separately.
- Important: The Discounts metric uses seller-funded amounts only. TikTok-funded discounts are tracked separately as Platform Subsidy.
Discounts
- What it shows: Seller-funded product discounts applied to each product.
- What is included: Seller vouchers and coupons, Product Discounts, Flash Deals, Buy More Save More, Bundle Deals, the seller-funded portion of co-funded vouchers, and other seller-funded campaign discounts.
- Important: TikTok-funded discount amounts are not included in Discounts. They are tracked separately as Platform Subsidy.
Cost of Goods Sold (COGS)
- What it shows: The total cost of products you sold during the selected period, per product.
- Formula: Unit Cost x Units Sold (per product/SKU)
- Example: Product A has a unit cost of $8 and you sold 50 units. COGS = $400.
- Important: You must set your unit cost in the Inventory page. If COGS is not set, it will show as $0 and Gross Profit will equal Net Sales. If you use FIFO Cost Tracking, the cost per unit is based on your purchase history rather than a single fixed cost.
Gross Profit
- What it shows: Revenue remaining after subtracting the cost of goods, per product.
- Formula: Net Sales - COGS
- Example: Product A has $1,375 Net Sales and $400 COGS. Gross Profit = $975.
- Important: This does not include fees, shipping costs, or commissions. For a complete profit picture per product, look at Operating Profit.
Operating Profit
- **What it shows: **Your real operational profit for each product after all operational expenses. At the shop level this figure is anchored to your TikTok settlement (the amount actually deposited once orders settle, net of TikTok’s fees); each product then receives its proportional share. Before orders settle, it is an estimate built from the fee components.
- **What’s inside it (breakdown): **For each product, Operating Profit covers Gross Profit plus Manual Income, less Shipping Costs, FBT Fees, Platform Fees, Affiliate Commissions, Sample Costs, Refunds & Returns, and Manual Expenses. Shop-level costs are distributed proportionally by each product’s share of revenue.
- **Example (illustrative breakdown): **Product A has $975 Gross Profit; $50 platform fees, $30 shipping, $25 affiliate commissions and $15 refunds are allocated to it, giving roughly $975 − $50 − $30 − $25 − $15 = $855. This shows how the components combine — the exact figure is reconciled against settlement, so a hand calculation may differ slightly.
- **Important: **This is the most comprehensive per-product profitability metric. Because the shop-wide total is settlement-anchored and then allocated, manually subtracting the visible rows for one product will approximate — not exactly reproduce — its Operating Profit, unless every row shares the same settlement / data-readiness state and proportional allocation basis.
Product Profit
- What it shows: Your final per-product bottom-line profit after all product-specific expenses and ad spend. Platform Subsidy is not added here -- it is already included in your sales revenue, so it is shown only as a separate reference column. This is the most complete profitability metric at the product level.
- Formula: Operating Profit − Net Ad Spend
- Example: Product A has $855 Operating Profit and $60 in ad spend allocated to it. Product Profit = $855 − $60 = $795.
- Important: Product Profit excludes shop-level manual adjustments that are not bound to a specific product. If you need to see the full picture including all adjustments, check the shop-wide Net Profit on the Dashboard or Profit & Loss page.
Margin
- What it shows: What percentage of revenue you keep as gross profit, per product.
- Formula: (Gross Profit / Net Sales) x 100
- Example: Product A has $975 Gross Profit and $1,375 Net Sales. Margin = 70.9%. That means you keep about $0.71 of every dollar of net sales for Product A.
- Important: Products with no sales will not show a margin value. A product with 0% Margin means your product cost equals your revenue -- you are breaking even before any other expenses.
ROI (Return on Investment)
- What it shows: How much operating profit you earn per dollar of inventory cost, per product.
- Formula: (Operating Profit / COGS) x 100
- Example: Product A has $855 Operating Profit and $400 COGS. ROI = 213.8%. That means you earn $2.14 in operating profit for every $1 spent on Product A.
- Important: Requires COGS to be set. Helps you compare the return on your investment across different products, even if they have different price points.
Units Sold
- What it shows: Total number of individual items sold for each product.
- Important: Counts individual items, not orders. A single order with 3 units of Product A counts as 3 units for Product A. In Statement-date reports, a later cash-only fee or shipping credit with no item quantity or merchandise sale does not add a sold unit or sales order. The signed credit remains included in the financial amounts.
Refunds & Returns
- What it shows: Dollar value of refunds issued for each product.
- Important: Includes product refunds and the financial impact of cancelled orders. Shown as a negative value because it reduces your profit. Refunds are attributed to the date they were processed (completion date), not the original order date.
Features
Shop Summary Cards
A row of configurable metric cards at the top showing aggregated metrics across all products. These show the same total values you would see on the Dashboard for the same date range. Click "Configure Metrics" to choose which metrics to display. Available metrics include:
- Revenue: Gross Sales, Net Sales, GMV, GMV (with TikTok Co-funding)
- Profit: Net Profit, Margin
- Costs: Ad Spend, Gross Ad Spend, Ad Credits, Shipping Fees, Net Shipping, Platform Subsidy
- Affiliates: Affiliate Ads, Affiliate Expenses, Affiliate Sales Commission
Table View and Card View
Switch between two display modes using the toggle in the top right:
- Table View (default) -- a detailed spreadsheet with all metrics, sortable columns, and search. Best for in-depth analysis.
- Card View -- products displayed as visual cards with key metrics (Gross Sales, Product Profit, Margin, ROI, Orders, Units). Best for a quick visual scan of your product lineup.
Click any product in either view to open its detail page.
Include Sample Costs
Open Filters and use Include sample costs to include or exclude the costs of free sample orders. When included, sample costs stay with the sampled product and SKU, and the same selection applies to Shop Summary, product rows, SKU details and downloads. Apply filters saves your personal choice for this page; it does not change another person's choices or the account defaults.
Time Period Selector
Quick tabs let you switch between Today, Yesterday, Last Week, or a custom date range. The custom date range supports selecting any start and end date.
Product Period Comparison
Use Compare products above the product list to compare the visible products with the Previous period or the Same period last year. Previous period uses an immediately preceding date range of the same length; for example, a seven-day report compares with the seven days before it. Same period last year uses the matching calendar dates one year earlier.
Gross Sales and Net Profit show the percentage change for each product in both table and card views. New means the product has a current-period value but no value in the comparison period. The comparison follows the current date basis, accounting basis, Sales Scope, sample-cost setting, figures, cancelled-sales treatment, search, and product or SKU view. It is supplemental: if the comparison cannot load, your current-period report remains available.
Sales Scope
Use Filters > Sales scope to control which sales are included in Shop Summary, product rows, SKU details, and downloads. The same three choices are available on Dashboard, Profit & Loss, Sales & Profit, and Product Overview:
- All sales — include every sale in the selected period.
- Only sales with a cost set — include SKUs whose sales in the selected period all resolve to a non-zero cost of goods. This checks the cost applicable to those sales, not just today's catalog cost.
- Only sales without a cost — find SKUs with at least one sale in the selected period that resolves to zero COGS.
TikTok does not provide a reliable way to identify every temporary, permanent, LIVE, or auction sale, so Dashboardly keeps this control focused on cost coverage.
Reloading the page or switching between Grid and Table view keeps the Sales scope you selected, including All sales when your account default differs. The selected scope is applied consistently to summary totals, rows, drill-downs, and exports. If Dashboardly cannot safely apply it, the page returns to All sales instead of mixing scoped and unscoped figures; an export that cannot honor the scope is cancelled.
Sales & Profit shares six reporting choices with Dashboard, Profit & Loss, Product Overview and Settings > Reporting: Date basis, Accounting basis, Sales scope, Include sample costs, Figures, and Include cancelled orders in sales. Open Filters, choose the combination, then select Apply filters. Order date follows when the sale was placed. Fulfillment date follows fulfilled activity and uses Accrual basis. Statement date, when available for the shop, follows TikTok's finalized reporting calendar and uses Settlement basis. Incompatible options remain visible with an explanation, and switching back restores your remembered choices.
Accounting Basis
Open Filters > Report basis to choose how profit is recognized. Order date supports the accounting bases available for your shop. Statement date requires Settlement basis, while Fulfillment date requires Accrual basis:
- Settlement basis follows TikTok settlement amounts where available and estimates for orders still being finalized. For TikTok-funded live or promotion discounts, the buyer can pay as little as one cent while TikTok still credits the seller’s item revenue. Dashboardly uses the original item price less the seller-funded discount for this estimate; the platform-funded discount is not treated as lost seller revenue.
- Accrual basis recognizes the order-side profit earned by orders sold in the selected period.
The applied reporting combination governs Shop Summary, product and SKU rows, comparisons, and downloads. For Order date + Settlement, Figures can include All figures, Settled orders only, or Fully settled days only. Settled orders only removes preliminary order figures but keeps independently incurred costs. Fully settled days only excludes an entire day when it still has preliminary or provisional figures. Accrual and Fulfillment use all applicable activity; Statement date uses all statement activity. Include cancelled orders in sales changes the sales and matching refund presentation, not Operating Profit or Net Profit, and does not add cancelled orders to paid Units. Accrual excludes cancelled sales.
Apply filters saves a personal choice for the current page. Shared account defaults are managed in Settings > Reporting by the owner or a collaborator with Reporting settings: Edit permission. Under My page overrides, you can return one page or all your pages to the account defaults. Applying a page filter does not change other users' choices or automatically apply that choice to another report.
If Dashboardly cannot apply Accrual consistently to both the Shop Summary and complete product attribution, the entire page returns to Settlement basis and shows a notice instead of mixing bases.
That fallback applies only to the selected date range. When you switch to another preset or custom range, Dashboardly retries your saved Order-date basis. If Accrual is available for the new range, the notice clears and the report returns to Accrual automatically.
Data confidence
Data confidence is available for active connected shops and summarizes the selected Sales & Profit date range and active report filters. Final means TikTok has provided settled statement transactions. Provisional means TikTok transaction data is available, but fees, refunds, or adjustments may still change. Estimated means Dashboardly is calculating some financial values until TikTok provides transaction data. Checking means settlement flags are incomplete or conflicting and Dashboardly cannot classify those orders yet. Changing the date range or filters recalculates the counts. If a trustworthy breakdown is not available, Dashboardly shows a neutral message while keeping the report values visible. These labels explain data finality; they do not change the financial calculations. Every eligible order in this breakdown is already included in the report totals. A count of 0 Final does not mean those orders are excluded; provisional and estimated values can change as TikTok finalizes settlement.
Counts and percentages describe orders, not the percentage of revenue or profit. An order with several SKUs is counted once. Every eligible order in the breakdown is already included in the report totals. “Still updating” means the current financial values are not final; it does not mean the order’s revenue, COGS, or profit has been excluded. You do not need to enable this feature or reimport your shop. Finality does not confirm that your own product costs are set; use Filters > Sales scope to check cost coverage separately.
Product-table search narrows the product list; it does not change the report-wide Data confidence breakdown.
Summary By Product
The main section below Shop Summary lists every product with its metrics. Features include:
- Search -- find products by name or SKU
- Sorting -- click any column header to sort ascending or descending
- Product drill-down -- click a product row to open the full product detail page with time-series charts and SKU-level breakdown
- Export — download the Product-tree XLSX for external analysis; a multi-SKU product's detail modal also has a CSV export.
The table columns are grouped by category:
- Revenue: Gross Sales, Net Sales, Discounts
- Cost & Profit: COGS, Gross Profit, Operating Profit, Product Profit
- Ratios: Margin, ROI
- Volume: Orders, Units
- Fees: FBT Fees, Ad Spend
- Manual Adjustments: Manual Income, Manual Expenses, FBS Manual Shipping, Net Manual Adjustment
- Affiliates: Affiliate Ads, Affiliate Ads Orders/Units, Affiliate Sales Orders/Units
- Refunds: Gross Sales Refund, Other Refund Costs, Returned Refunds, Refund Orders/Units
Some columns (Platform Subsidy, Affiliate Sales Commission, Cancelled Orders) are hidden by default -- expand column groups to reveal them.
Product Detail Page
When you click on a product, you see:
- Time-series charts showing how the product's metrics changed over the selected period
- SKU tabs for products with multiple variants, including an All SKUs view
- Accounting basis shared with Profit & Loss and Sales & Profit. Under Accrual, Settlement reconciliation (reference only) shows the bridge back to TikTok's current settlement estimate. A separate Other profit reconciliation row may appear for rounding or allocation differences; it is not presented as a fee type.
- Manage Unit COG for dated cost history. If a specific SKU tab is selected, the button opens that SKU's periods. In All SKUs, a multi-SKU product opens a SKU chooser instead of silently editing a product default. A one-SKU product selects its only SKU automatically.
- Profit Breakdown with merchandise sales, customer-paid shipping, shipping deductions, fees, COGS, adjustments, and ad spend shown as separate components. Gross Sales itself excludes shipping.
- All the same metrics (Gross Sales, Net Sales, COGS, Gross Profit, etc.) broken down by each SKU
Configure Metrics
The "Configure Metrics" button lets you choose which metric cards appear in the Shop Summary section. Your selections are saved and persist across sessions.
Export
To export a custom date range, open Sales & Profit, select Custom Range, choose your start and end dates, and click Apply. After the product data loads, click Export XLSX above Summary by Product. If the button is not visible, switch to Table view. The download follows the selected dates, timezone, search, date and accounting bases, Sales Scope, sample-cost setting, figures, cancelled-sales treatment and visible columns. Product ID and SKU ID are stored as exact text so spreadsheet apps do not round long identifiers. The filename includes the start and end dates. Use View SKUs and its Export button for the corresponding product's modal CSV.
Large Product-tree XLSX exports may take a few minutes to prepare. Keep the page open; Dashboardly keeps the same export in progress through brief connection interruptions and downloads it as soon as it is ready.
With Include sample costs enabled, Product-tree exports include sampled SKU variants even if they had no ordinary sales in the selected period. Sample COGS, shipping and fees stay with the variant sent as a sample; they are not spread across other variants. For example, if only the blue variant was sampled, the red variant does not receive part of that sample cost. The export still follows your selected products and SKUs, search, Sales Scope, dates and sample-cost setting.
Shop Summary CSV: Open Sales & Profit, choose the date range and reporting filters, then click Export summary CSV beside Configure Metrics in the Shop Summary section. The file contains one combined row for the whole shop and includes every available Shop Summary metric, including cards hidden from your current layout. It also records the selected dates, timezone, currency, accounting and date bases, figures, sales basis, Sales Scope and sample-cost setting. The button becomes available after the selected report finishes loading and contains metrics.
Product Overview summary CSV: Open a product from Sales & Profit and select Overview. Choose your date range, keep All SKUs selected for the whole product, then click Export summary CSV beside Filters. The file contains one combined summary row with all available Overview card metrics, including cards hidden from your current layout. It also records the selected dates, timezone, currency, SKU scope and reporting filters. The button is available after the selected report finishes loading and contains data.
If you select one SKU at the top of the product page, the summary CSV covers that SKU. To download separate rows for individual sizes or variants, use SKU Performance, click See all metrics, choose Columns → Full report, then click Export CSV.
How Per-Product Expenses Work
Some expenses in Dashboardly are tracked at the shop level (not per-product), such as platform fees, shipping costs, and affiliate commissions. To show a meaningful Operating Profit per product, these shop-level expenses are distributed proportionally across products based on each product's share of total revenue.
Example: If Product A makes up 30% of your total revenue and the total platform fees are $1,000, then $300 in platform fees is allocated to Product A.
This proportional distribution means:
- The per-product Operating Profits add up to (and reconcile against) the shop-wide, settlement-anchored Operating Profit
- Small differences can occur from rounding and from products being in different settlement / data-readiness states when you view them
- Products with higher revenue absorb a larger share of shop-level expenses
Common Questions
Why does a product show $0 for COGS and Gross Profit equals Net Sales?
If a product has sold units but no resolved COGS, check its unit cost and cost history in Inventory. A current cost does not prove that earlier sales were priced. Statement-date reports can include orders placed before the selected month: an order placed on July 31 and first settled on August 3 needs the cost applicable to July 31. A cost period starting on August 1 does not fill an earlier gap. Review the original order date before changing a cost period. See Setting Up Cost of Goods (COGS) for step-by-step instructions.
Why do per-product numbers not add up to the shop total exactly?
Shop-level fees (like platform fees and shipping costs) are distributed proportionally across products based on their revenue share. Mathematical rounding can cause tiny differences (typically less than $0.01). Additionally, some expenses like manual adjustments may be applied at the shop level and distributed proportionally.
Why does Data confidence change when I change filters?
The counts belong to your current selection, not the whole shop. Dashboardly recalculates Final, Provisional, Estimated, and Checking whenever you change the date range or report filters. A recent selection can contain more orders that are still updating, while an older settled range can contain more Final orders. The report values remain visible and update automatically as TikTok publishes additional transaction and settlement information.
Why is my Operating Profit lower than expected for a product?
Operating Profit includes many deductions that are not visible in simpler metrics: TikTok platform fees, affiliate commissions, shipping costs, FBT fulfillment fees, refund costs, and sample order expenses. These are distributed proportionally by revenue share. A product with high revenue will absorb a larger share of shop-level expenses. Check the Profit & Loss page for a detailed breakdown of every expense category.
How does COGS work for products with multiple SKUs?
Set a dated product-level default in Inventory when variants share the same cost. Add a dated SKU override when one variant differs. For each sold unit, Dashboardly uses a priced FIFO lot first, then the SKU period active on the order date, then the product period active on that date. On the product detail page, select a SKU tab before clicking Manage Unit COG to edit that SKU directly; All SKUs opens a chooser for multi-SKU products.
Why do refund numbers differ between this page and the P&L?
Both pages use the same data. However, if you are comparing a specific product's refunds on this page to the total refunds on the P&L page, remember that the P&L shows all products combined. The refund values on this page are attributed to individual products based on the actual items that were refunded.
TikTok statement adjustments in Accrual
On Accrual basis, product-attributed TikTok statement adjustments appear as signed rows and are included exactly once in Operating Profit. They do not create an equal-and-opposite Other Profit Reconciliation.
Other Profit Reconciliation appears only when a genuine remaining allocation or rounding difference still needs to be explained. When the named rows fully explain Operating Profit, it is zero and hidden.
If Dashboardly cannot verify complete statement attribution or the independent profit sources, the whole Product/SKU view returns to Settlement basis instead of mixing accounting bases.
Choose the basis in Filters > Report basis and select Apply filters to save it for this page. Settings > Reporting controls shared defaults and My page overrides. Match all six reporting choices, the exact dates, shop and timezone before comparing reports.
Statement date reporting
Open Filters on Sales & Profit and choose Statement date when it is available for your shop. Statement date groups finalized TikTok activity by the Seller Center reporting calendar and always uses Settlement basis. Dashboardly distributes the complete shop statement across products and SKUs before applying a Product or SKU filter, so Shop Summary, product rows, SKU rows, and Profit & Loss reconcile when you use the same date range, sales scope, and sample-cost setting. Choose View SKUs to inspect the same result at SKU level. If Statement date is unavailable, use Order date; Accrual is intentionally unavailable while Statement date is selected. For automatic FBS shipping / unit costs, the order's first finalized statement determines the reporting period and the original order date determines the dated rate. This rate applies to eligible seller-fulfilled units, not FBT units. When comparing a spreadsheet, match the fulfillment population and effective cost dates as well as the visible reporting month.